All guides › Measurement uncertainty
When should I use a top-down or bottom-up approach to measurement uncertainty?
Use a top-down approach when you have performance data that represent the measurement as a whole. Use a bottom-up approach when a model and evidence about individual inputs give the better account of the result. A combined approach can use routine performance data and add a distinct contribution that those data do not represent.
Worked example at a glance
Routine IQC
Imprecision near 6 mmol/L
Assigned value
Check the calibration contribution
Manual dilution
Consider the extra step
Decide what the estimate needs to cover
Start with the measurand, concentration range and conditions of use. Ask which parts of the measurement your evidence represents. Top-down and bottom-up describe how the evidence is assembled. The same measurement can be described using a mixture of performance data and estimates for particular inputs. [1] [2]
Follow one laboratory’s evidence
A laboratory has stable routine control data near 6 mmol/L for its glucose procedure. The data cover routine runs, different operators and several recalibrations on the analyser of interest. They give evidence of within-laboratory imprecision near that concentration. That is a reason to use the control data for the part of the estimate they represent. [1]
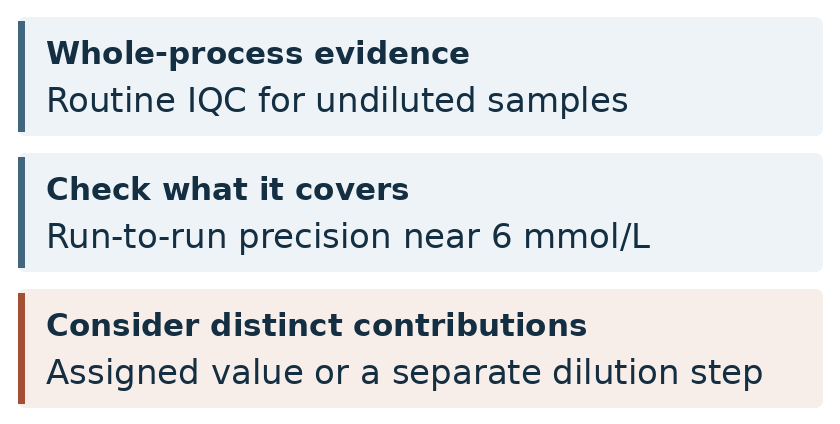

The calibrator has an assigned concentration with an uncertainty given on its certificate. A value shared across the control series may affect the scale of the results without appearing as scatter between runs. The laboratory checks whether this contribution is already represented elsewhere in its estimate. If it is relevant and separate, the estimate can include it alongside routine imprecision. [1] [2]
The same laboratory can make different choices for different uses. For undiluted measurements, a representative control series may answer the imprecision question directly. For a result corrected using a manually recorded dilution factor, understanding the additional step may matter more. Specify the form of the reported result before deciding which evidence can describe it.
Know when a model adds something useful
Suppose the laboratory starts reporting measurements from specimens that need a manual dilution before analysis. Its routine controls do not undergo that step. A measurement model can show where the dilution factor enters the result and which volumes affect it. That gives the laboratory a specific contribution to evaluate. It can also consider whether repeat data covering the entire diluted process would provide suitable evidence. [2]
A bottom-up model is useful when you can identify the relevant quantities and describe how they affect the reported result. Its coverage depends on the model and the quality of the input evidence. A top-down estimate depends on how well the performance data represent the whole procedure. Either approach can leave an important step outside the estimate.
For a combined estimate, be explicit about the boundary between the contributions. Suppose a separate study repeats the entire dilution procedure and reports the resulting spread. That study may include ordinary measurement imprecision as well as dilution variability. Adding its full SD to the routine control SD could double count the shared part. Check the scope of each study before combining its estimates. [1] [2]
Record why you chose the approach
| Evidence | Where it can help |
|---|---|
| Routine data | Estimate variation already present in the process |
| Model inputs | Estimate contributions associated with specific quantities |
| Both | Combine distinct contributions with their scope made explicit |
Example wordingRoutine control data represent imprecision for undiluted samples near 6 mmol/L. The calibrator’s assigned-value uncertainty is considered separately. The estimate for manually diluted samples will also address the dilution step using evidence relevant to that process.
When the evidence is incomplete, state the present scope and the work needed to extend it. That is more informative than assigning one estimate to every result from the procedure.
Member Learning
Build and explain an uncertainty estimate
Work through a simple estimate using routine control results and calibrator information, then practise explaining where it can be used.
Sources and related reading
- ISO/TS 20914 · Practical guidance for estimating measurement uncertainty · Medical laboratory guidance on estimating measurement uncertainty.
- JCGM GUM-6 · Developing and using measurement models · Guidance on choosing and checking a measurement model.
See how a measurement model works
Download the free preparation pack
By Stephen MacDonald · Suggest a correction · Back to Find a guide