All guides › Measurement uncertainty
How do uncertainties in the inputs affect uncertainty in the final result?
An input’s contribution depends on both its own uncertainty and how strongly the reported result responds to it. A measurement model makes that relationship explicit and puts the contributions into units of the final result.
Worked example at a glance
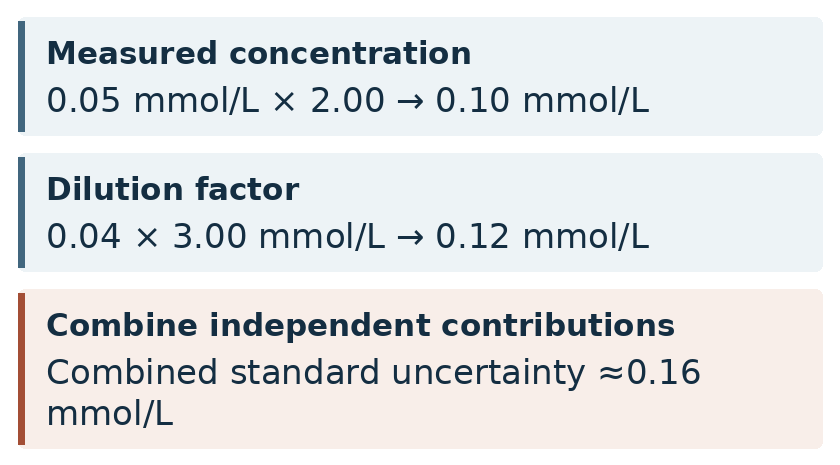
0.10 mmol/L
Concentration contribution
0.12 mmol/L
Dilution contribution
≈0.16 mmol/L
Combined standard uncertainty
Write the relationship you actually use
A laboratory reports a concentration after manually diluting a sample. It calculates the original concentration as the measured concentration in the diluted sample multiplied by the dilution factor. That simple equation is the measurement model for this example. It identifies the two inputs and shows how a change in either affects the reported value. [1]
The measured concentration after dilution is 3.00 mmol/L and the dilution factor is 2.00. The reported concentration is 6.00 mmol/L. The standard uncertainty of the measured concentration is 0.05 mmol/L and that of the dilution factor is 0.04. Treat the inputs as independent for this illustration.
Translate each uncertainty into the result’s units
Hold the dilution factor at 2.00. A change of 0.05 mmol/L in the measured concentration changes the result by 0.10 mmol/L. Now hold the measured concentration at 3.00 mmol/L. A change of 0.04 in the dilution factor changes the result by 0.12 mmol/L. The multipliers are called sensitivity coefficients. They express how much the result changes for a small change in each input. [1] [2]

| Input | Input u and effect |
|---|---|
| Measured value | Input u: 0.05 mmol/L Effect: 0.10 mmol/L |
| Dilution factor | Input u: 0.04 Effect: 0.12 mmol/L |
The dilution factor has a dimensionless uncertainty. The model converts its effect to mmol/L, which makes it possible to compare it with the contribution from the measured concentration. In this example the dilution factor gives the larger contribution.
The model also helps decide where better evidence would make a difference. Here the dilution-factor contribution is slightly larger, but both matter. Reducing the uncertainty of an input with little influence on the result would have less effect than improving evidence about an input with a larger contribution. Compare those contributions at the concentration and dilution factor you actually use. [1]
Combine contributions on a common basis
Under the first-order model and the stated independence assumption, combine the two standard uncertainty contributions in quadrature. Square 0.10 and 0.12, add the squares and take the square root. The combined standard uncertainty is approximately 0.16 mmol/L. Correlated inputs require their covariance to be considered. [2]
One practical check is to ask whether the performance data already include the manual dilution step. If the concentration uncertainty already represents repeats of the complete diluted procedure, adding a separate dilution contribution could count part of the same variation twice.
The independence assumption belongs beside the calculation. For example, if two volume estimates depend on the same calibration, their errors may be related. That can change the combined uncertainty. A model should reflect such shared influences where they matter, and the record should make the assumption visible to the person reviewing the calculation. [2]
Know when to revisit the calculation
A simple sensitivity calculation is often enough when the model behaves nearly linearly over the plausible input range. If the response changes substantially across that range or produces an asymmetric distribution for the result, examine the model more closely. Monte Carlo propagation is one option when the input distributions and dependencies can be described. [1] [3]
Example wordingThe model shows why a dimensionless dilution factor can make an important contribution to uncertainty in a concentration. Compare the effects in units of the result before judging which input matters most.
Member Learning
Build and explain an uncertainty estimate
Work through a simple estimate using routine control results and calibrator information, then practise explaining where it can be used.
Sources and related reading
- JCGM GUM-6 · Developing and using measurement models · Guidance on choosing and checking a measurement model.
- JCGM 100 · Guide to the expression of uncertainty in measurement · Combining standard uncertainties and expressing expanded uncertainty.
- JCGM 101 · Propagation of distributions using a Monte Carlo method · When and how to propagate input distributions through a model.
Document the uncertainty estimate
By Stephen MacDonald · Suggest a correction · Back to Find a guide