INTERNAL QUALITY CONTROL
Internal quality control (IQC): interpreting signals and responding to change
IQC helps detect changes in a measurement process. Its value depends on the material, control levels, timing, decision rules and response—not simply on whether a chart contains points inside two lines.
Free IQC email course · Five emails · Ten days
What is your QC result telling you?
Make control materials, charts, signals and repeats easier to understand through five short emails. Simple explanations and occasional reflections, with no calculations or workbook.
By Stephen MacDonald · Updated 30 September 2026
Control limits and performance specifications answer different questions
Control limits describe expected behaviour under specified conditions and support detection of change. A performance specification states the analytical quality required for an intended use. A stable process can still be unsuitable for that use; a control signal indicates a need for investigation, not the size of patient-result error. [1, 2]
Keep the labels explicit. A limit based on the control material’s SD, an EQA assessment limit and an expanded uncertainty interval are not interchangeable because they happen to share the same units. Link the QC plan to the required analytical performance rather than assuming the chart alone establishes fitness for purpose.
Read the sequence as well as the latest point
In this fictional example the laboratory uses a previously established target of 100 units and SD of 2 units. The displayed target ±3 SD interval is therefore 94–106 units. These parameters are fixed; they are not estimated from the twenty points shown.
From run 11, the control results shift upwards. Every value remains inside the displayed interval, but run 18 completes eight consecutive results above the target. A plan containing that rule would signal at run 18 even though a check for individual points beyond ±3 SD would not. Other rules could signal earlier; this example does not evaluate a complete rule set. [2]
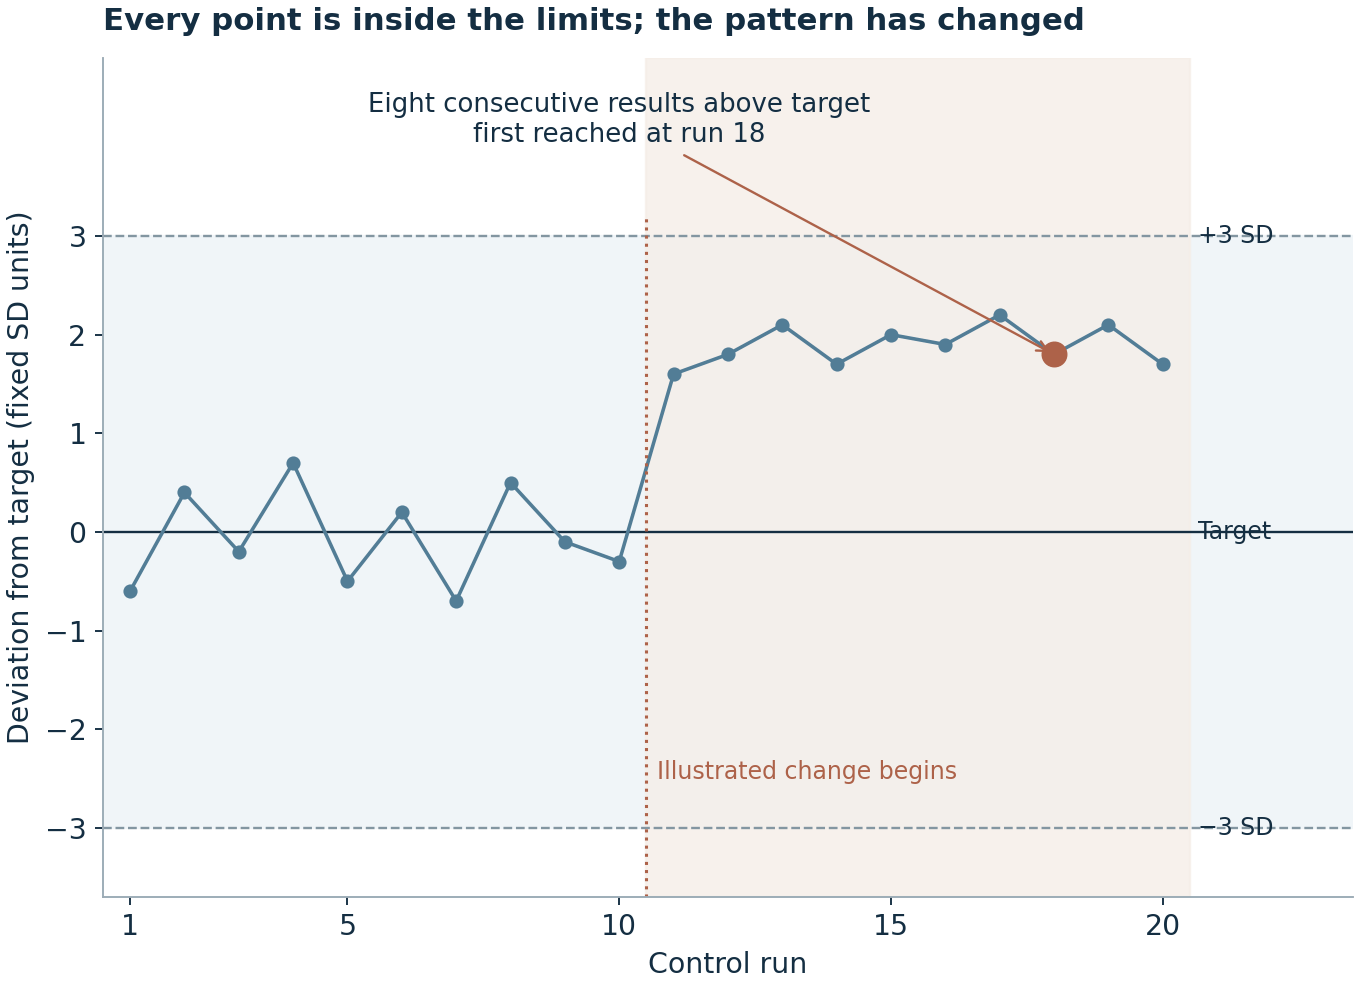
The lesson is to interpret observations against the rules specified in advance. Adding more rules can increase sensitivity and false alarms. The combination needs to be justified for the measurement procedure and the consequences of missed problems; the illustrated rule is not a universal recommendation.
Design the control plan around the failure you need to detect
| Plan element | Practical question |
|---|---|
| Material and levels | Will these controls respond to the relevant analytical problem at concentrations that matter? |
| Frequency and timing | How much patient testing could occur before a problem is detected? |
| Decision rules | What signal triggers action, and what are the detection and false-alarm characteristics? |
| Response | Who investigates, who decides about release, and how is recovery demonstrated? |
CLSI C24 addresses statistical QC design and response to control events; EP23 places QC within a broader assessment of the measuring system, laboratory setting and clinical application. Neither implies that one frequency or rule combination is suitable for every examination. [1, 3]
Respond to a signal with an investigation
Follow the laboratory’s authorised procedure for release, escalation and any review of potentially affected results. Examine the sequence and the timing of calibration, reagent changes, maintenance, control preparation and storage. Decide which additional checks can distinguish a control-material problem from a measurement-process problem.
A repeat may contribute useful evidence, but repeating until a result falls inside the limits does not explain the event. Preserve the initial result and record why repeats were performed. If patient results could be affected, define the relevant period and evidence needed for review rather than assuming that a later acceptable control clears all earlier work.
Do not reset the chart to hide a change
Combining an unexplained shift with earlier results can move the calculated mean and widen the SD. The chart may then appear quieter because its comparison basis has changed. Investigate first. A justified new target or limit may be appropriate after a verified change, but document the reason, supporting data and date of application. [2]
A change in control lot also changes the material being monitored. Plan how the new target and variability will be established and how continuity will be assessed; do not assume that the old lot’s numerical target transfers unchanged.
Know what the control material represents
Controls need to be suitable for the intended monitoring task. Their behaviour does not automatically reproduce patient-specimen behaviour, and acceptable IQC cannot exclude every interference or pre-analytical error. Commutability is relevant when using material results to infer relationships between measurement procedures. [4]
Long-term IQC can inform the precision component of a measurement uncertainty estimate when the data represent the relevant conditions. It does not by itself supply every uncertainty contribution. Keep periods, levels, lots and exclusions traceable, and distinguish routine variation from investigated failures.
Close the loop
The useful endpoint is a documented conclusion: what changed, what was affected, what action was taken and how recovery was established. Review recurring events to decide whether the control plan itself needs improvement. Connect that record to verification, EQA and periodic review so that each contributes a different part of the evidence.
Sources and further reading
[3] CLSI EP23. Laboratory Quality Control Based on Risk Management. Public scope and overview.
[4] CLSI EP14 Guide. Evaluation of Commutability of Processed Samples. Public scope.
Original educational explanations and fictional examples. Consult full standards for procedural requirements and use a locally approved plan for laboratory decisions.
Continue learning
- Define the required analytical quality
- Interpret EQA evidence
- Use routine data in an uncertainty estimate
- Connect routine monitoring to verification
Suggest a correction — identify the page and passage concerned.
Record an IQC problem clearly
Use six short questions to describe what happened, note what has been checked and record who will review it next. A clear fictional example shows how brief the notes can be. Follow your local procedure for immediate action and urgent concerns.
Get the free IQC review pack · Free Word and PDF files, with a one-page fictional example. No payment or account required.
Choose the explanation you need
For a quick definition, look up internal quality control, precision or analytical performance specification.
Member course: Understanding internal quality control provides five structured lessons with guided and independent cases, feedback and saved progress. It is an introduction to interpretation; detailed QC-plan design is outside its scope. Membership required.
Prefer a short introduction by email? The five-email IQC course is free, with its own sign-up.