All guides › Statistics and interpreting results
What does a p-value tell me about a laboratory comparison?
A p-value describes how unusual the observed test statistic would be under the null hypothesis and the assumptions of the test. To interpret a laboratory comparison, read it alongside the estimated difference, its uncertainty and the difference that would matter in practice.
Worked example at a glance
+2 units
Mean difference in both studies
12 pairs each
Same sample size
0.005 vs 0.193
Two-sided p-values
Read the p-value in relation to the question tested
A paired t-test can ask whether the population mean difference is zero. Under that null hypothesis and the test’s assumptions, a two-sided p-value is the probability of a test statistic at least as far from zero as the one observed, in either direction. It is conditional on the null model. [1] [2]
A smaller p-value means the result is less compatible with that model. It does not give the probability that the null hypothesis is true. The size of a difference, how precisely it was estimated and whether it matters require separate information. [1]
Hold the estimated difference fixed
Two fictional studies each measure 12 specimens by both methods. The estimated mean difference, B minus A, is +2 units in both. The paired differences are more variable in study B.

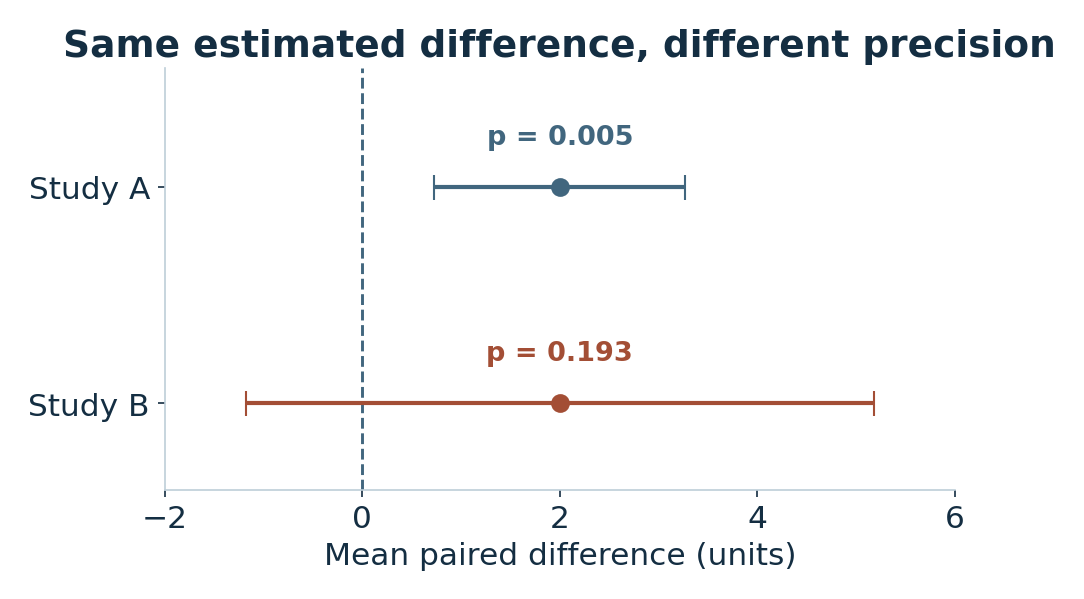
The greater spread in study B gives a wider interval and a larger p-value. The estimated mean difference stays at +2 units. Study A’s interval excludes zero, while study B’s interval includes zero and also includes positive differences larger than those in study A’s interval.
Here the p-values come from two-sided paired t-tests. The intervals use the same model and estimate the mean difference across specimens.
Compare the interval with a difference that matters
The table shows that the studies have the same number of pairs and the same estimated mean. The precision differs.
| Statistic | Study A | Study B |
|---|---|---|
| Pairs | 12 | 12 |
| Mean difference | +2.0 units | +2.0 units |
| SD of differences | 2.0 units | 5.0 units |
| 95% CI | 0.73 to 3.27 | −1.18 to 5.18 |
| Two-sided p-value | 0.005 | 0.193 |
Suppose 3 units is the largest average difference the laboratory would regard as acceptable for this purpose. Both intervals extend above +3 units. Even study A’s smaller p-value does not settle whether the mean difference is within that limit.
To judge whether the methods can be used interchangeably for individual specimens, also examine the spread of the paired differences and how they vary with concentration. The interval here is for the mean.
Report the estimate, interval and test together
State the size and direction of the estimate, the confidence interval and the test. This gives the reader more information than a significance label.
Example wordingStudy B estimated a mean difference of +2.0 units (B minus A), with a 95% confidence interval from −1.18 to +5.18 units and a two-sided paired t-test p-value of 0.193.
Member Learning
Plan a laboratory study and prepare your data
Work through a laboratory study, from planning and checking the source data to summarising results and explaining their limits.
Sources and related reading
- Wasserstein and Lazar · The ASA statement on p-values (2016) · Explains the interpretation and limits of p-values, including their relationship to effect size.
- NIST/SEMATECH e-Handbook · Two-sample t-test · Distinguishes paired from unpaired comparisons and explains the role of within-pair differences.
Read when to use SD, CV, standard error or a confidence interval · Read about agreement between laboratory methods
By Stephen MacDonald · Suggest a correction · Back to Find a guide