All guides › Practical statistics
When should I use SD, CV, standard error or a confidence interval?
Use standard deviation (SD) for spread between observations and coefficient of variation (CV) for spread relative to the mean. Use the standard error or a confidence interval when the question is about the precision of the estimated mean.
Worked example at a glance
1.58 units
Sample SD
0.71 units
Standard error of the mean
8.04–11.96 units
95% confidence interval for the mean
Start with one set of repeat results
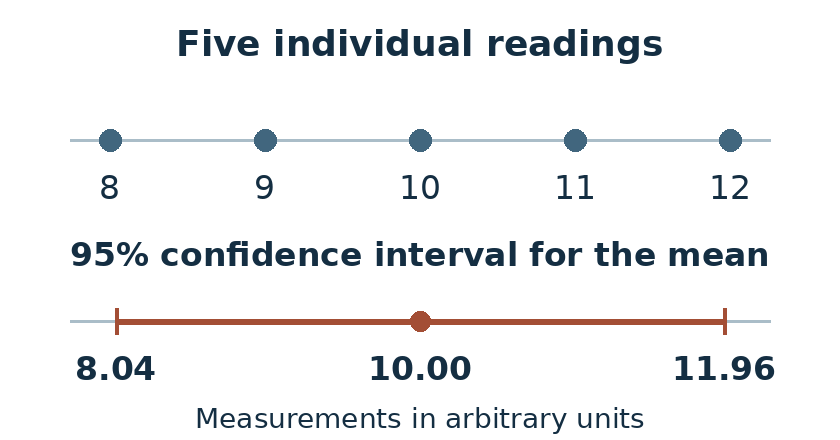
Suppose five independent repeat measurements of a stable control give 8, 9, 10, 11 and 12 units. The sample mean is 10. The sample SD is about 1.58 units. The SD describes how far the individual observations tend to lie from the mean. It stays in the units of the observations.
The CV expresses the SD relative to the mean. Here it is 1.58 divided by 10, or 15.8%. This can be useful when comparing spread at different concentrations, provided the scale has a meaningful zero and the mean is sufficiently far from zero. Near zero, a modest absolute spread can give a large or unstable CV. [1]
Separate spread from the precision of the mean
The standard error of the mean estimates how much the sample mean would vary across repeated samples of the same size, under the assumptions used. Here it is the sample SD divided by the square root of five, about 0.71 units. The SD and standard error are both in units, but refer to different quantities. [2]

Collecting more independent measurements from the same stable process can give a more precise estimate of the mean. That change does not make the individual readings less variable. When assessing imprecision of individual laboratory results, the distinction matters.
Consider what a second sample of five might show. Its individual readings could have roughly the same spread, while its mean lands a little higher or lower. The standard error describes that second kind of variation. It is estimated from the same observations here, but it answers a question about means rather than individual readings. [2]
Read the confidence interval for what it is
A 95% confidence interval for the mean uses a multiplier and the standard error. With five independent measurements from an approximately normal population, the t multiplier for four degrees of freedom is about 2.78. In the illustration the interval is approximately 8.04 to 11.96 units. The 95% refers to the long-run coverage of the interval procedure under its assumptions. [2]
The interval estimates a population mean. If your question is where an individual future reading might fall, you need an interval designed for individual observations. Check the design before using the simple formula. For example, several measurements made on the same day can share conditions that make them less independent than their count suggests.
Choose the scale that makes sense for the comparison. If two control levels have different means, SD shows the spread in the original units and CV shows it as a proportion of the mean. Both may be relevant. If you are estimating an average from one set of measurements, report the confidence interval and how the measurements were collected so a reader can judge the assumptions.
Choose the summary that answers your question
| Quantity | Question and example |
|---|---|
| SD | How spread out are the readings? 1.58 units. |
| CV | How large is the spread relative to the mean? 15.8%. |
| SE | How precise is the mean estimate? 0.71 units. |
| 95% CI | What interval does the procedure give for the mean? 8.04–11.96 units. |
If you write “10 ± 1.58 units”, label the 1.58 as the sample SD. If you give the confidence interval, say that it is for the mean and name the confidence level. Keeping the label attached to the number prevents two readers from giving the same result different interpretations.
Member Learning
Practise the statistics behind an uncertainty estimate
Work through the calculations and assumptions behind the statistics used in a simple measurement uncertainty estimate.
Sources and related reading
- NIST/SEMATECH e-Handbook · Measures of scale · How to describe the spread of observations.
- NIST/SEMATECH e-Handbook · Confidence limits for the mean · The t interval and its interpretation.
- NIST Dataplot · Coefficient of variation · Definition and conditions for interpreting relative spread.
Browse all five statistics guides
Use routine data in a measurement uncertainty estimate
Explore the distribution viewer
Use the one-sample t calculator
By Stephen MacDonald · Suggest a correction · Back to Find a guide