METHOD COMPARISON
Method comparison: agreement, differences and clinical acceptability
A method comparison asks how results differ, where the differences matter, and whether the evidence supports the proposed use. A high correlation answers only part of that question.
By Stephen MacDonald · Updated 30 September 2026
Define the comparison before collecting results
Start with the intended decision: replacing a procedure, using two instruments interchangeably, or investigating a suspected difference. Identify the measurand, specimen types, concentration range and clinical uses. Agree what difference would be acceptable, and how uncertainty in that estimate will affect the conclusion.
Use paired patient specimens representative of that scope. Record handling, storage, measurement timing and relevant lots or calibrations. A large number of convenient specimens in the middle of the range does not establish performance at its edges. CLSI EP09 provides the relevant framework for quantitative patient-sample comparison; its public overview does not supply a complete study protocol. [1]
Why correlation can look reassuring
Correlation describes how closely two quantities follow a linear relationship. It does not establish that their values are sufficiently similar. The distinction is central to the original work of Bland and Altman. [2]
In Figure 1, procedure A gives 10, 20, …, 100 units. Procedure B gives 12, 24, …, 120 units. Pearson’s correlation is exactly 1.00, yet B is 20% higher than A at every point. At A = 10 the difference is 2 units; at A = 100 it is 20 units. The percentage here is calculated relative to A: 100 × (B − A) / A.
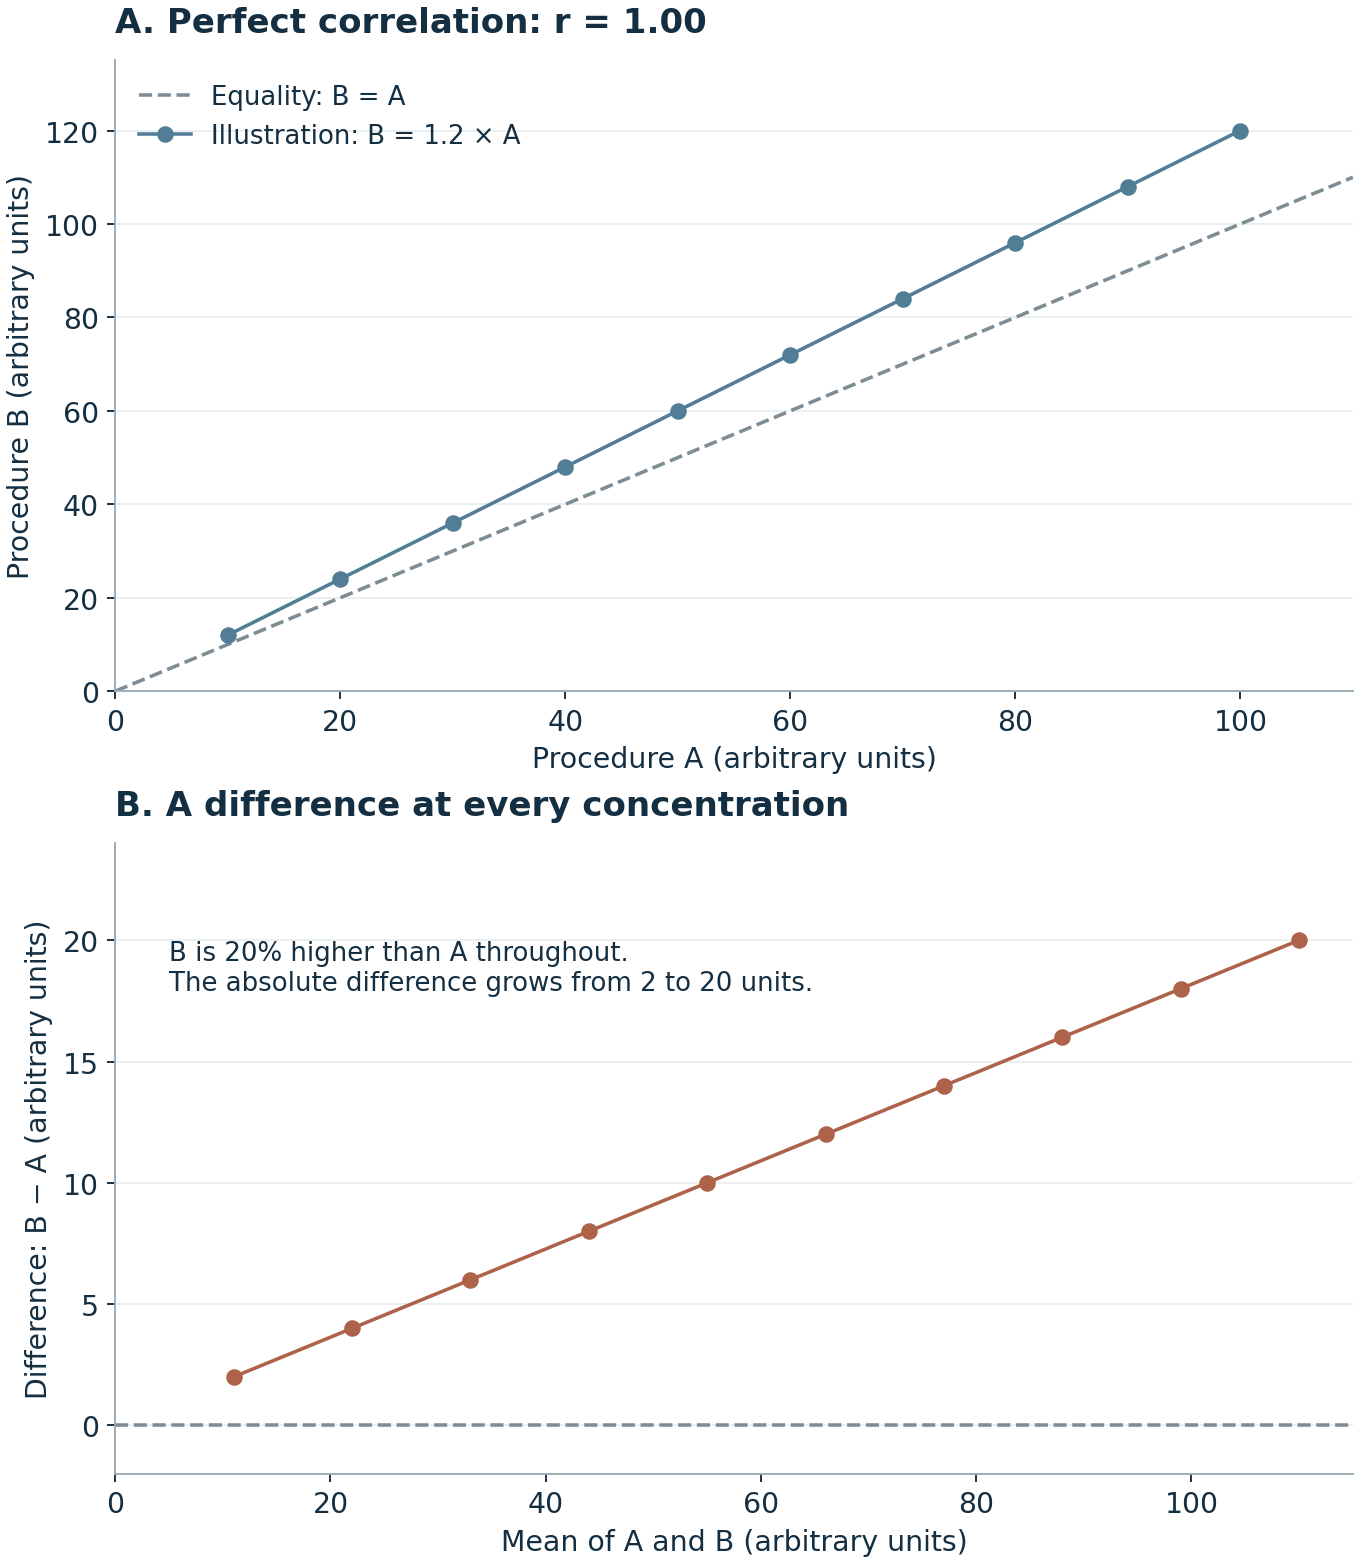
This example does not show that either procedure is correct. It shows why correlation cannot decide whether their results can be exchanged. If a decision depended on an absolute difference of a few units, the same proportional difference could have different implications across the range.
Read the plots together
| View | Question to ask |
|---|---|
| Paired-result scatter plot | Where are the observations relative to the equality line, B = A? Is the relevant range covered? |
| Difference plot | Does the size or spread of B − A change with concentration? Are there unusual specimens? |
| Estimated relationship | What difference is expected at the concentrations relevant to the intended use? How uncertain is that estimate? |
A difference-versus-mean plot is useful when neither method supplies a reference value. A comparison against an appropriate reference may justify a different horizontal axis. Label the axis and the denominator of any percentage difference explicitly. Relative differences become unstable near zero; a percentage view is not automatically appropriate throughout the range.
Separate average difference from individual disagreement
A small mean difference can coexist with large positive and negative differences in individual pairs. These may cancel in the average while still affecting interpretation. Under suitable assumptions, limits of agreement describe the spread of differences; a confidence interval around the mean difference describes uncertainty in that estimated mean. They are different quantities. [2]
Where differences vary systematically with concentration, one overall summary can conceal the problem. Inspect the pattern before choosing an absolute, relative or transformed analysis. Neither a confidence interval nor limits of agreement supply the clinical acceptance criterion: that must be justified separately.
Choose regression for the data you have
Both procedures usually contribute measurement error. Ordinary least squares treats the predictor differently from the response; it is not automatically the appropriate default. Deming and Passing–Bablok approaches address different modelling assumptions. Changing imprecision across the range may require weighting or transformation. EP09 discusses these choices and estimation at specified concentrations. [1]
A fitted line should help answer the laboratory question. Reporting a slope near one without assessing the intercept, uncertainty, concentration coverage and individual differences is insufficient. Investigate unusual pairs using documented criteria; removing inconvenient points can create an artificially favourable comparison.
Keep the reference claim proportionate
An established routine procedure is a comparator, not automatically a reference measurement procedure. Agreement with it does not establish trueness. Describe the direction of the comparison and use “difference relative to the comparator” where a stronger reference claim is unsupported. The comparator’s traceability, uncertainty and known interferences matter. [3]
Write a conclusion with boundaries
A useful conclusion states the use supported, the range and specimen types studied, the estimated differences and their uncertainty, the acceptance criterion and any unresolved limitation. For example, evidence supporting routine mid-range use may leave a low decision threshold unassessed. That is a defined evidence gap, not a reason to claim agreement everywhere.
Keep specimen-specific discrepancies visible and connect the findings to verification, reference intervals or decision limits where relevant. The aim is a justified implementation decision, not simply a statistically significant relationship.
Sources and further reading
[3] CLSI. Measurement Procedure Comparison in the Clinical Lab. 2020.
Original educational explanations and fictional examples. Consult full standards for procedural requirements and use a locally approved plan for laboratory decisions.
Continue learning
- Choose an analytical performance specification
- Plan the wider verification
- Understand calibration, traceability and bias
- Interpret external quality assessment
Suggest a correction — identify the page and passage concerned.