All guides › Calibration and traceability
Why can two methods traceable to the same reference give different results?
Two methods can name the same higher-order reference and give different values on the same patient sample. Traceability tells you where each calibration chain leads. Patient-sample comparisons show how closely the methods agree in practice.
Worked example at a glance
1 reference
Named for both methods
5 patient pairs
Fictional comparison across the range
+7 units
Largest Method B difference from the reference procedure
Separate the reference from the route to it
Two manufacturers can start from the same reference and use different working materials, calibration procedures or instrument models along the way. The materials used to transfer values and the way each method responds to a patient specimen can affect the result. Measurement variability can also contribute to the difference seen on any one sample. [1] [2]
Compare the measurand and the scope of each claim. The same units and similar wording in a product insert can hide differences in what the methods respond to. Where the claims appear comparable, results from suitable patient samples can show where agreement is close and where it needs more attention.
Compare both methods with the same patient reference results
Suppose two fictional manufacturers name the same reference in their traceability statements. Five patient specimens are measured using both routine methods and a reference procedure for the same measurand.
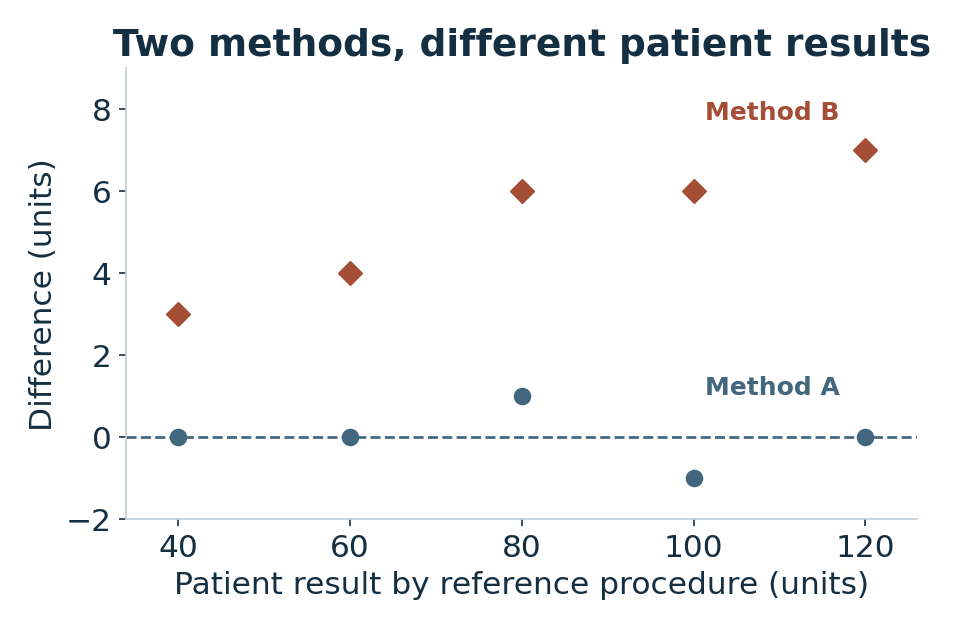
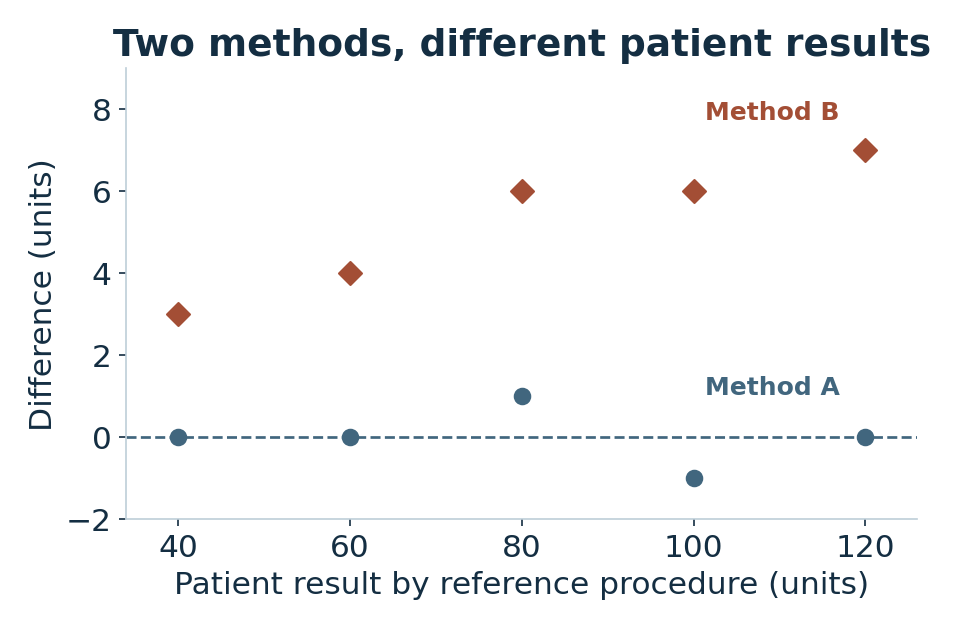
Each point shows the routine result minus the value from the reference procedure. Method A stays within 1 unit across these samples. Method B is higher by 3 to 7 units. The shared endpoint in the documentation and the observed differences answer separate questions.
The size and direction of the differences suggest where to look. The five pairs alone give too little evidence to identify the cause or establish performance across the whole measuring range.
Ask what the patient comparison supports
At 100 units, the two routine methods differ by 7 units. Comparison with the reference procedure also shows which way each method differs.
| Reference result | Method A | Method B |
|---|---|---|
| 40 units | 40 | 43 |
| 80 units | 81 | 86 |
| 100 units | 99 | 106 |
| 120 units | 120 | 127 |
A comparison between A and B alone would show a 7-unit difference at this level. The reference procedure provides an additional point of comparison, with its own uncertainty.
If the difference matters at the concentrations where results are used, check the measurand definitions, value assignment routes and relevant material behaviour. Interpret the size of the difference against the performance needed for the intended use. [1] [2]
Record the claim and the observation separately
Name the shared reference as a documented claim and give the direction and size of the differences from the actual comparison.
Example wordingBoth manufacturers identify the same higher-order reference. In the five specimens examined, Method B was 3 to 7 units above the reference procedure. The cause of that difference remains to be established.
Member Learning
Build and explain an uncertainty estimate
Work through a simple estimate using routine control results and calibrator information, then practise explaining where it can be used.
Sources and related reading
- JCGM · International Vocabulary of Metrology, 2.41 · Defines metrological traceability and explains what a traceability claim establishes.
- Camara et al. · Assessing commutability by calibration effectiveness (2018) · Shows how patient-sample results can be used to assess a candidate calibrator.
Read what a calibrator certificate tells you · Read about agreement between laboratory methods · Take the free traceability email course
By Stephen MacDonald · Suggest a correction · Back to Find a guide