All guides › Analytical performance specifications
How can clinical outcomes inform an analytical performance specification?
Start with a decision that depends on the laboratory result and ask what analytical error could change it. An outcome-based specification uses evidence about the consequences of that change to set a limit on the analytical performance the result needs.
Worked example at a glance
9 units
Fixed underlying value
10 units
Fictional decision threshold
2.3% vs 15.9%
Crossing with two levels of imprecision
Start with the decision and its consequence
A laboratory result may determine whether someone is offered further investigation, classified into a different group or considered for a change in treatment. If two plausible reported values would lead to different action, the quality required of the measurement depends partly on what that change would mean for the patient. The Milan consensus calls this an outcome-based approach. [1]
The use needs to be specific. The same measurand might support an initial decision in one setting and a change from baseline in another. The decision rule, the concentration of interest and the consequences of crossing it can all differ. A requirement justified for one use needs its own case before it is carried over to another.
See how imprecision can change a classification
Suppose a fictional pathway changes at 10 units. Hold the underlying concentration at 9 units and assume a method with zero bias and normally distributed analytical variation. The standard deviation (SD) is either 0.5 or 1.0 units. In this simplified model, a reported value above 10 would cross the decision threshold despite the underlying value being below it.

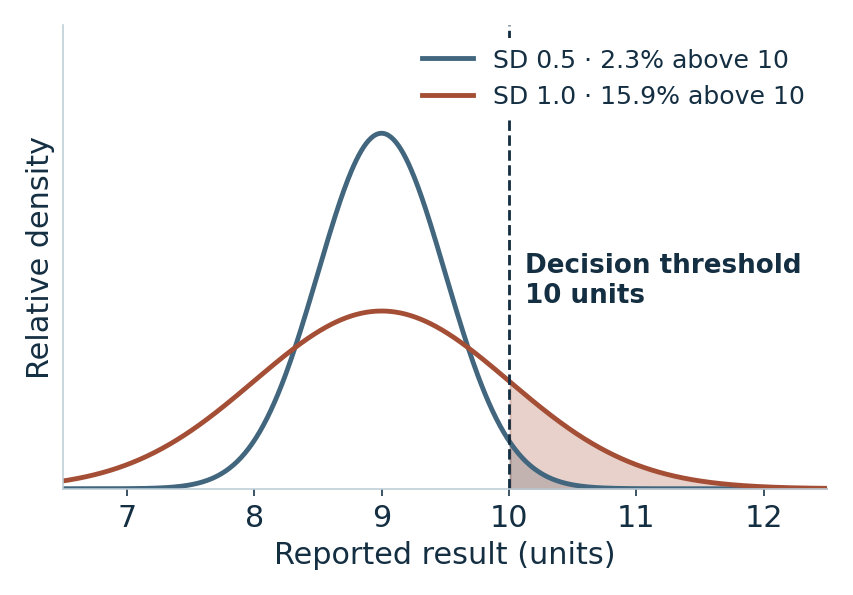
With the smaller SD, 10 is two SDs above the underlying value. About 2.3% of repeated results lie above it. With the larger SD it is one SD above, and about 15.9% lie above it. Those are probabilities for one underlying concentration in this model. Change the distance to the threshold or introduce bias and the probabilities change. [2]
Connect classification to outcomes
An indirect outcome study can estimate how analytical bias or imprecision would change decisions. To extend this example, model the distribution of underlying results in the relevant population, count changes in both directions and consider what follows each change. Missing an indicated action and triggering an unnecessary one can have different consequences. The importance of each depends on the pathway. [1] [2]
| Analytical SD | Above 10 units |
|---|---|
| 0.5 units | About 2.3% |
| 1.0 units | About 15.9% |
Direct outcome evidence would link changes in analytical performance to observed patient outcomes. A model of threshold crossing supplies one intermediate step. It can show where measurement performance might matter and help compare candidate limits. To justify a specification, the laboratory still needs a reason for the acceptable rate or consequence of changed decisions. [1]
When a result is used as a continuous measure of risk, an error can also change the estimated risk without crossing a single cut-off. The relevant question is what changes in the clinical pathway. Even with a threshold, the number of people close to it matters to the overall effect. [1] [2]
Write down the basis for the requirement
Record the intended use, the decision rule, the performance characteristic and the consequence you are trying to limit. Where you use a model, document its assumptions and check how much the conclusion changes when they vary. Include analytical bias and imprecision where they matter, since both can shift the chance of crossing a threshold. [2]
Example wordingIn this illustration, increasing the SD from 0.5 to 1.0 units increases the probability of crossing the 10-unit threshold for an underlying value of 9. The model describes analytical reclassification at that concentration. A specification would require evidence about which changes in decisions are acceptable for the intended use.
Member Learning
Practise interpreting a proposed specification
Understanding analytical performance specifications (APS) helps you check the evidence behind a proposed specification and explain whether it is suitable.
Sources and related reading
- Sandberg et al. · EFLM Milan consensus on analytical performance specifications · The three models and the distinction between direct and indirect outcome evidence.
- Evaluation of analytical performance specifications based on test misclassification · An indirect outcome model examining analytical bias, imprecision and test misclassification.
Read what makes a specification fit for purpose · Read why concentration coverage matters in a method comparison
By Stephen MacDonald · Suggest a correction · Back to Find a guide