All guides › Analytical performance specifications
Why are allowable bias and imprecision separate requirements?
Bias describes how far the average result is from a suitable reference value. Imprecision describes how much repeat results vary. A method can meet the requirement for one and fall short on the other, so each needs an appropriate limit and evidence.
Worked example at a glance
100 units
Assigned value
±2%
Fictional bias limit
≤3% CV
Fictional imprecision limit
Decide what each requirement should control
Bias is an estimate of systematic difference relative to an appropriate reference value. Imprecision describes random variation under specified conditions, such as measurements across days within the laboratory. Analytical performance specifications can set separate requirements because the two affect results in different ways. A persistent shift moves the centre of the results. Greater imprecision increases their scatter. [1] [2]
Both requirements can be percentages and still have different denominators. Relative bias is the difference between the observed mean and reference value, divided by the reference value. The coefficient of variation (CV) is the SD divided by the observed mean. Keep the names, signs and denominators attached to the numbers.
Compare the centre and spread of two methods
A fictional material has a suitably assigned concentration of 100 units. Repeated measurements with method A have a mean of 103 units and an SD of 1.5 units. Method B has a mean of 100.5 units and an SD of 4.5 units. Suppose the laboratory has specified relative bias within ±2% and a within-laboratory CV of 3% or less at this level.

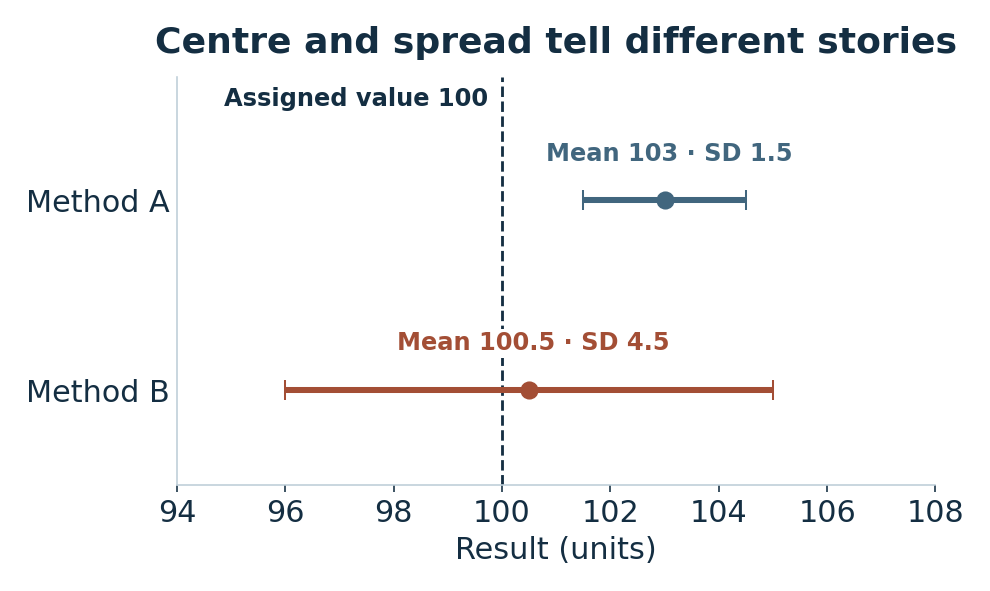
Method A is closer to its own mean on repeat measurements, but its mean is 3 units above the assigned value. Method B has a mean only 0.5 units above the assigned value, but its repeated results are more spread out. The chart shows why a result near the reference value on one occasion provides limited evidence about either characteristic.
Read the two comparisons separately
For method A, (103 − 100) ÷ 100 gives +3.0% bias and 1.5 ÷ 103 gives about 1.5% CV. For method B, (100.5 − 100) ÷ 100 gives +0.5% bias and 4.5 ÷ 100.5 gives about 4.5% CV. Compare each estimate with the requirement that applies to it.
| Method | Bias | CV |
|---|---|---|
| A | +3.0% | 1.5% |
| B | +0.5% | 4.5% |
On the point estimates, method A meets the imprecision requirement but exceeds the bias limit. Method B meets the bias requirement but exceeds the imprecision limit. In a real study, consider uncertainty in the estimated mean, the assigned value and the estimated CV, especially when the result is near a limit. Check that the assigned value is appropriate for the material and method. [2]
Keep the direction of bias in the record. A positive and a negative bias of the same size are equally far from the assigned value, but may have different consequences near a decision threshold. More imprecision can increase the chance of results moving in either direction. The intended use determines which effects matter most. [1]
Say which performance characteristic needs attention
A useful verification record states the two estimates, the requirements and the concentrations tested. Where results are compared with an established routine method, describe the observed difference relative to that method unless there is evidence supporting a stronger reference claim. Evidence at one concentration does not establish either bias or imprecision across the whole measuring range. [2] [3]
Example wordingAt the 100-unit level, method A’s CV estimate was below 3%, but its +3.0% relative bias exceeded the ±2% limit. Method B’s +0.5% relative bias was within the limit, while its CV estimate exceeded 3%. Each conclusion applies to the stated study conditions.
Member Learning
Practise interpreting a proposed specification
Understanding analytical performance specifications (APS) helps you check the evidence behind a proposed specification and explain whether it is suitable.
Sources and related reading
- Sandberg et al. · EFLM Milan consensus on analytical performance specifications · The three models and the distinction between direct and indirect outcome evidence.
- CLSI EP15 · User Verification of Precision and Estimation of Bias · Laboratory guidance on evaluating precision and estimating bias.
- CLSI EP09 · Measurement Procedure Comparison and Bias Estimation Using Patient Samples · Comparison across concentrations using paired patient samples.
Read what makes a specification fit for purpose · Read what a verification study can tell you
By Stephen MacDonald · Suggest a correction · Back to Find a guide