All guides › Internal quality control
When should I review my IQC mean and control limits?
Review the baseline when the conditions it represents may have changed, such as at a planned control-material lot transition or after a documented change in the measurement procedure. Review means checking whether the current baseline still represents stable performance.
Worked example at a glance
100 units
Old control lot centre
104 units
New lot centre in the illustration
102 units
Mean if both sets were pooled
Identify what has changed
A QC mean and its limits describe a baseline for a specified procedure, control material and set of conditions. A new control-material lot can require an updated target. A documented change in the measurement system can also trigger review. If a chart shifts unexpectedly, first establish whether the shift represents a problem or a justified new set of conditions. [1] [2] [3]
Review and revision are separate decisions. A review can establish that the current limits remain appropriate. It can also identify a reason to collect separate data or use the laboratory’s approved transition procedure while a new baseline is assessed.
Keep the control-material lots separate
Suppose a laboratory is introducing a new lot of control material. It collects data under a planned transition and checks the relevant evidence that the measurement system is performing as expected. In the fictional chart, the old material is centred near 100 units and the new lot near 104. The scatter within each lot is similar.

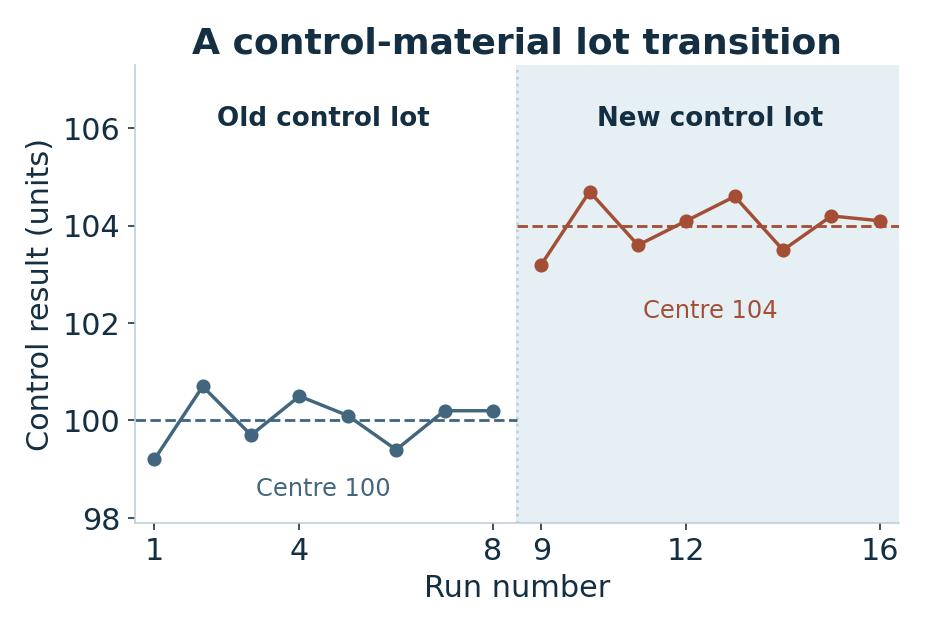
The change here is the lot of control material, rather than a reagent lot change. The different observed control means do not by themselves establish a change in patient results. The relevant question is whether each series represents stable conditions for that control lot.
Decide which variation the baseline should represent. A series from one run can describe repeatability for that run. Routine control limits usually need evidence from the days and conditions the QC plan is intended to cover. The short series in the figure demonstrates the effect of mixing lots. It does not establish the amount of evidence needed for new limits. [1] [2]
See what pooling would do to the limits
If you pool the two sets shown, the mean becomes 102 units. Neither lot is centred there. The pooled SD is about 2.13 units, compared with about 0.52 and 0.53 for the separate sets. The larger number incorporates the difference between lot centres as well as the spread within each lot.
| Dataset | Mean and sample SD |
|---|---|
| Old control lot | 100.0 units · SD 0.52 |
| New control lot | 104.0 units · SD 0.53 |
| Both lots pooled | 102.0 units · SD 2.13 |
If you used that larger SD to set limits, the chart could become less sensitive to a change within one lot. Keeping the records separate lets you assess each lot against evidence relevant to it. Use representative stable data for any estimate and follow the local procedure for how provisional and established limits are set. [1] [2] [3]
If a change in spread is suspected, compare it with the earlier spread under comparable conditions. A wider SD can arise from mixing conditions, as in this example. It can also reflect a real change in imprecision. Those explanations call for different follow-up before any decision to widen the limits.
Record the basis for the revised baseline
When a revision is justified, record the control lot, period and conditions studied, the data included, the mean, the basis of the SD and limits, and the effective date. Retain the earlier baseline and why it was replaced. The limits are part of a QC strategy and need to make sense alongside the method’s performance requirements and the intended use of the results. [1] [2]
Example wordingThe new control-material lot gave a different centre under the conditions reviewed. Data from the two lots were assessed separately. Any revised baseline will be recorded with the evidence that supports it and the date from which it applies.
Member Learning
Practise reading a control chart
Understanding Internal Quality Control (IQC) takes you through the chart, the changes that need attention and the laboratory’s response.
Sources and related reading
- CLSI C24 · Statistical Quality Control for Quantitative Measurement Procedures · Guidance on designing and using statistical QC for quantitative measurements.
- Recommendations for the application and follow-up of quality controls in medical laboratories · Practical guidance on control levels, routine review and follow-up.
- NIST/SEMATECH e-Handbook · Variables control charts · Control limits, rules and reasons to review a baseline.
Read why a chart can signal within limits · Read how to decide whether routine data represent the measurement conditions
By Stephen MacDonald · Suggest a correction · Back to Find a guide