All guides › External quality assessment
What can a pattern across several EQA rounds tell me?
Looking at EQA results in sequence can help distinguish an isolated unusual result from a repeated difference in the same direction. Read the pattern alongside the assigned values, materials and assessment rules used in each round.
Worked example at a glance
6 rounds
In each fictional series
+3.3
Isolated score in series A
6 positive scores
In series B
Look at direction as well as flags
A flag tells you how a result was assessed for one distribution. A sequence also shows where results sit relative to zero and whether unusual values recur. A positive score means the result was above the assigned value. When scores are repeatedly positive, the direction can be informative even if each score falls within the scheme’s satisfactory band. [1]
The comparison matters throughout. A recurring difference from a same-method peer target has a different meaning from a recurring difference from a reference-assigned value for commutable material. Treat the pattern as a description of those comparisons first. [1]
Compare two sequences of reports
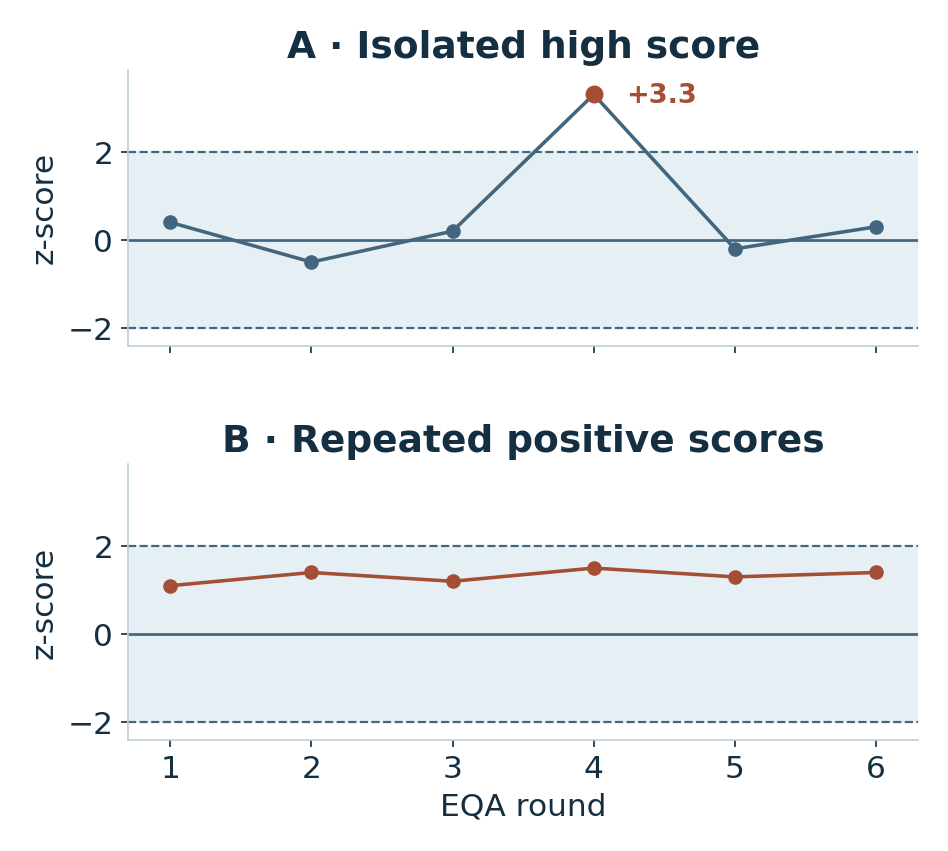
Imagine two fictional sets of six comparable rounds for one examination. The plots use the same vertical scale and an illustrative satisfactory range of −2 to +2.
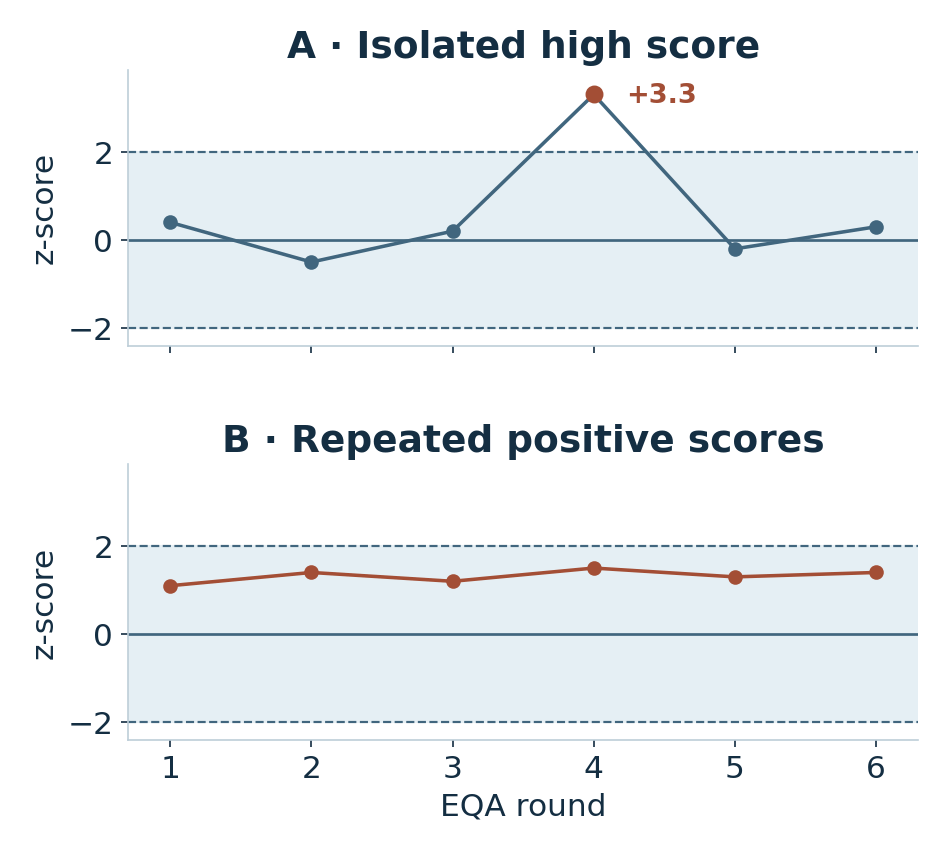
In series A, round 4 stands out at +3.3. The other scores sit near zero on both sides. That makes round 4 the obvious place to look for something unusual in the specimen, analysis or reporting.
In series B, every point stays inside the band, and all six are positive. The values sit at a similar level rather than increasing over time. This suggests a recurring difference worth reviewing. The scores alone do not establish its cause. [1]
Check that you are comparing like with like
A plot shows the shape of a pattern. The reports tell you what each point represents.
| What you see | Question to ask |
|---|---|
| One unusual score | What was different in this round? |
| Repeated scores above zero | What might explain the recurring difference from the assigned values? |
| Change when the comparator changes | Did the result, the comparison or both change? |
Check the method, specimen material and concentration, the target source, and the scoring scale. If the scheme narrows its assessment SD, the score can increase with the same difference in measurement units. If the target source changes, the sign may change even when your result does not. [1]
Where the reports allow it, keep the underlying signed difference beside each score. Look at related IQC and relevant laboratory changes when the chronology gives you something concrete to compare. [1] [2]
Describe the pattern before naming a cause
State which rounds you compared, what was consistent, and the direction of the difference. If the rounds are substantially different, describe those differences alongside the pattern.
Example wordingAcross six comparable rounds, the results were consistently above the assigned values, with z-scores between +1.1 and +1.5. The series shows a recurring positive difference relative to the scheme’s comparator.
Member Learning
Continue with guided laboratory learning
Explore the released courses on laboratory quality, measurement uncertainty, study preparation and statistics.
Sources and related reading
- Eurachem · Selection, use and interpretation of proficiency testing schemes (2021) · Section 8.2.4 explains how to monitor performance across comparable rounds and why the assessment scale matters.
- UK NEQAS · Manchester participants’ handbook (2023) · A scheme example of reviewing isolated results and cumulative patterns alongside IQC.
Read the guide to EQA targets · See how a pattern can trigger an IQC signal · Take the free EQA email course
By Stephen MacDonald · Suggest a correction · Back to Find a guide