All guides › Calibration and traceability
What is the difference between a calibrator and a control?
A calibrator sets the relationship between instrument response and the value reported. A control is then measured as a separate check on how the system is performing. A calibration can complete successfully while a control result still gives you reason to look closer.
Worked example at a glance
100 units
Assigned calibrator value
57–63 units
Illustrative control limits
54 units
Observed control result
Distinguish setting the scale from checking it
A measuring system detects a signal such as an optical response. Calibration relates signals to known values so the system can turn a patient sample’s response into a result. The number of calibration points and the form of the relationship depend on the method. [1]
With internal quality control, the laboratory measures a control and compares its result with expected behaviour for that material. Repeating the checks over time can show a change in level or variability. The control result is assessed using the laboratory’s QC plan. [2]
Read the control result after calibration
A fictional analyser completes calibration using a material with an assigned value of 100 units. The laboratory then measures a separate control. Its target is 60 units and its illustrated control limits are 57–63 units.

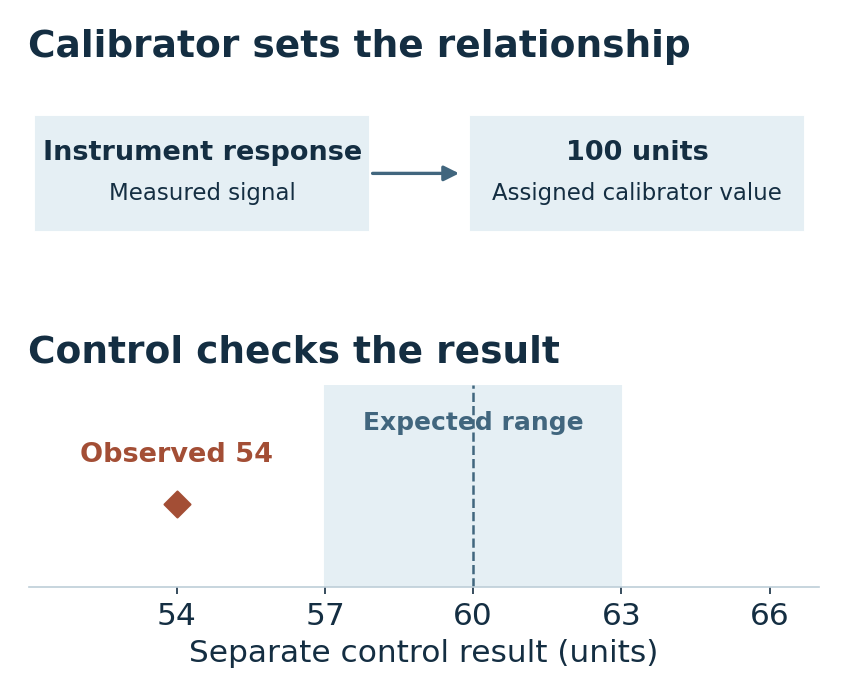
The analyser returns 54 units for the control. The calibration has completed, and the separate check gives an out-of-limit result. These observations describe different steps.
The control result tells you there is a signal to review under the laboratory’s procedure. Possible explanations include control preparation, calibration, reagent or instrument changes. The result alone does not identify which explanation applies.
Check what the control can detect
The control adds evidence because its result was measured after calibration and assessed against its own expected behaviour.
| Question | Calibrator | Control |
|---|---|---|
| What does it do? | Sets the relationship | Checks observed performance |
| Which value is used? | Assigned value | Expected result and limits |
| What happened here? | Calibration completed | Result below its limit |
If a material was used to fit the calibration, measuring it again may show that the system reproduces that calibration point. A separate control can reveal problems that a check on the fitted point can miss. The concentration and behaviour of the control material affect what that check covers. [1] [2]
A material’s role comes from its use. An assigned value can appear on documentation for either a calibrator or a control. Ask whether the value was used to set the response or to assess an independently obtained result.
Record the two observations
Keep the calibration outcome and the QC result distinct when you describe the event.
Example wordingCalibration completed using the 100-unit calibrator. The subsequent control result was 54 units, below the control limits of 57–63 units. The QC signal was recorded for review.
Member Learning
Practise reading a control chart
Understanding Internal Quality Control (IQC) takes you through the chart, the changes that need attention and the laboratory’s response.
Sources and related reading
- JCGM · International Vocabulary of Metrology, 2.39 · Defines calibration as a relationship between indications and reference values.
- CLSI C24 · Statistical Quality Control · Public overview of guidance for applying statistical QC in the medical laboratory.
Read what a calibrator certificate tells you · Read how an IQC chart can signal within limits · Take the free traceability email course
By Stephen MacDonald · Suggest a correction · Back to Find a guide